One feature of my python meteorological package pyMeteo is SkewT/LnP plotting from various data formats. These plots can read directly from certain kinds of model input and output data files from command line scripts and from numpy arrays in your python scripts.
Skew-T / Ln-P diagrams
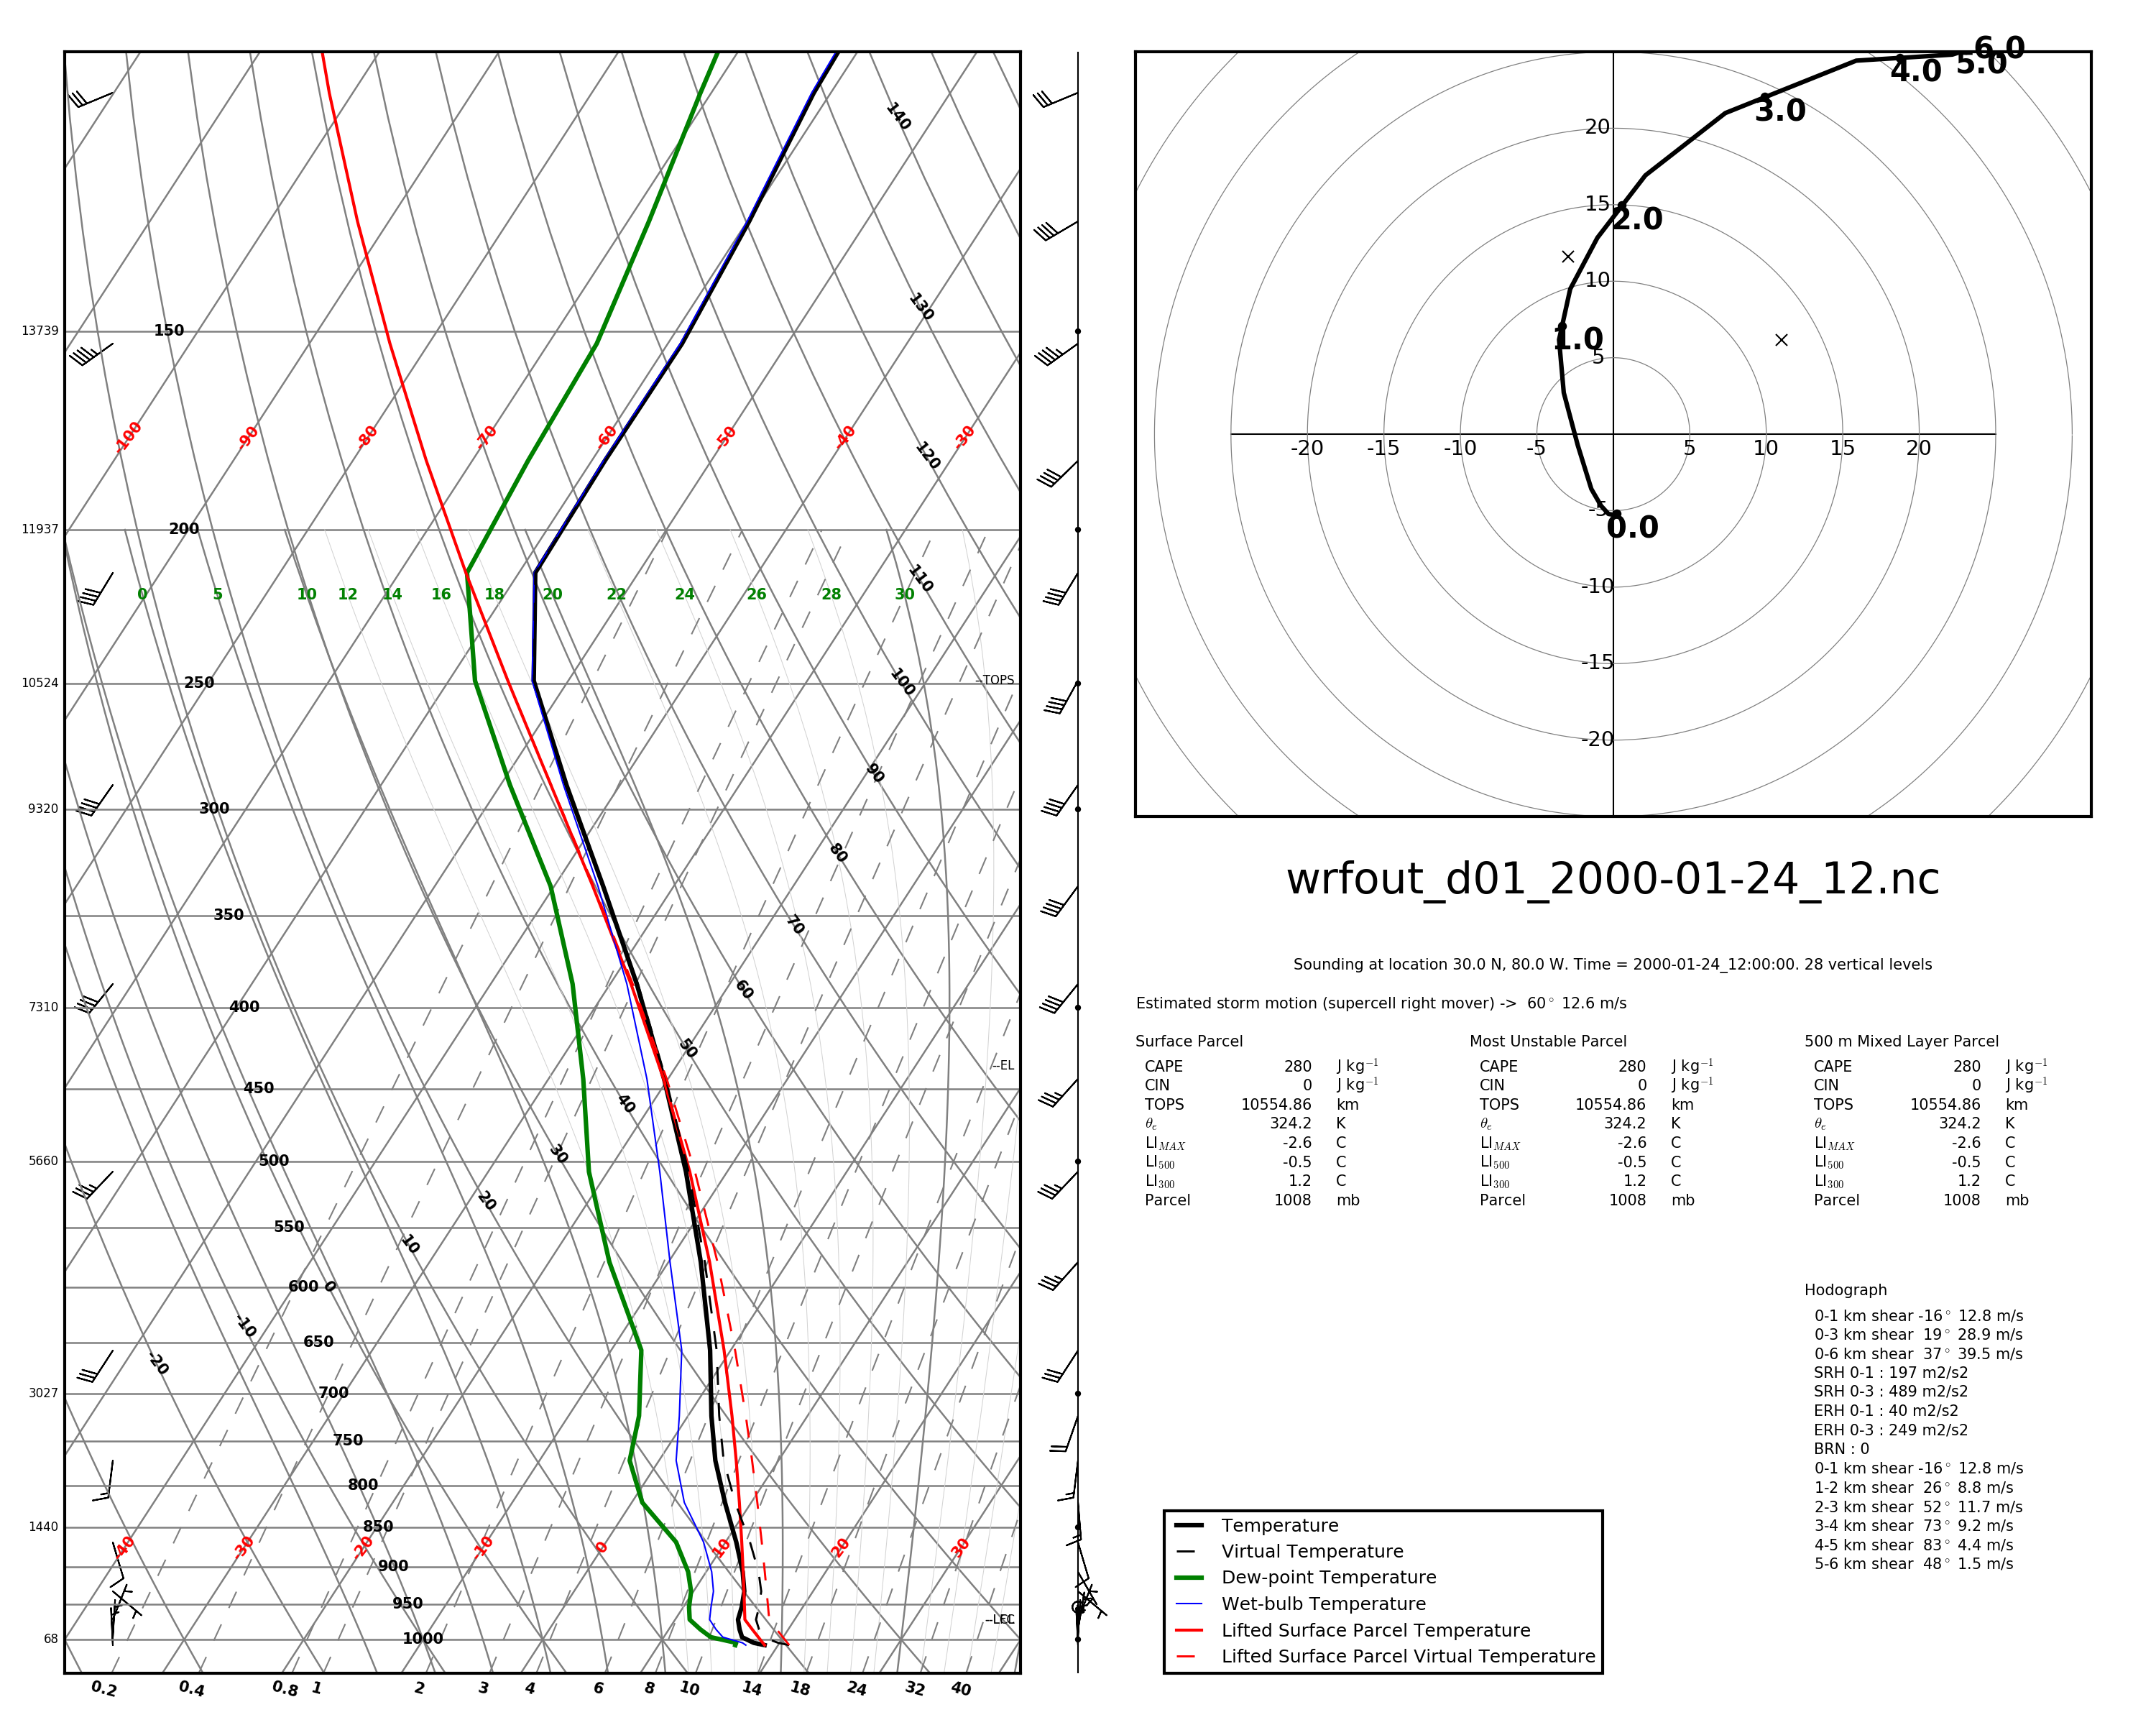
Skew-T / Ln-P plots are simply 2-D plots with a skewed temperature axis and a logarithmic pressure axes (y). Data plotted on this style of plot include temperature, dew point, and various other derived values such as the temperature of a parcel lifted from the surface. The plots produced by these scripts also have a hodograph plotted and a data block with convective storm parameters.
Example plot
Plotting from data
In all of the plotting methods, the plot output type is determined by the extension of the output file provided. You can write any type of file that the matplotlib backend can write.
Tabular
If you have tabular data suitable for WRF or CM1 model initialization, you can plot a skewt of this data with:
$ skewt -f sounding.dat -o skewt.pdf
The format of the sounding data file is
1 line header that contains: surface pressure (mb) surface theta (K) surface qv (g/kg)
following lines are: height (m) theta (K) qv (g/kg) u (m/s) v (m/s)
CM1
For CM1 output in native GrADS format, you can plot a skewt from model output with
$ skewt -p . -d cm1out -x 0 -y 0 -o skewt-cm1.pdf
In this case, -p is the path to the dataset, -d is the CM1 output_basename, -x and -y are the location of the plot in km and -o is the file to output. The current version (v0.4) of this script only works for CM1 datasets that are output with one file per timestep and will plot whatever timestep the file contains.
CM1 / HDF5
For CM1 output in HDF5 format, you can plot a skewt from model output with:
$ skewt-hdf -d model-data.h5 -x 0 -y 0 -o output.pdf
This currently requires that HDF5 output be un-tiled (though it might work for tiled files, I have not checked). The options are as in the CM1 GrADS version except that there is no -p and -d references a specific HDF5 file. This also assumes one file per timestep and will plot whatever timestep the file contains.
WRF
For WRF output in NetCDF format, you can plot a skewt from model output with:
$ skewt-wrf -d wrfout.nc --lat 30 --lon -80 -t 0 -o skewt.pdf
In this case, -d references a WRF output file, --lat and --lon reference a location within the WRF domain, -t reference a timestep within the WRF output and -o specifies an output files.
From Numpy arrays
import numpy as np
import pymeteo.skewt as skewt

# prepare 1D arrays height (z), pressure (p), potential temperature (th),
# water vapor mixing ratio (qv), winds (u and v) all of the same length.

skewt.plot(None, z, th, p, qv, u, v, 'output.pdf')
You can also choose to plot just the sounding, just the hodograph or plot each on on axes that you define. For details see the implementation of pymeteo.skewt.plot() and the pyMeteo documentation.
Comments